At 11:55, a canteen may look adequately equipped. At 12:05, the entrance fills, one popular main dish slows the line, a replacement pan has not arrived and the payment point stops customers who have already been served. The design problem is not the number of meals produced that day. It is whether every required step can absorb the actual service wave without losing control of food condition, portions or customer movement.
Draw the Service Wave Before Drawing the Counter
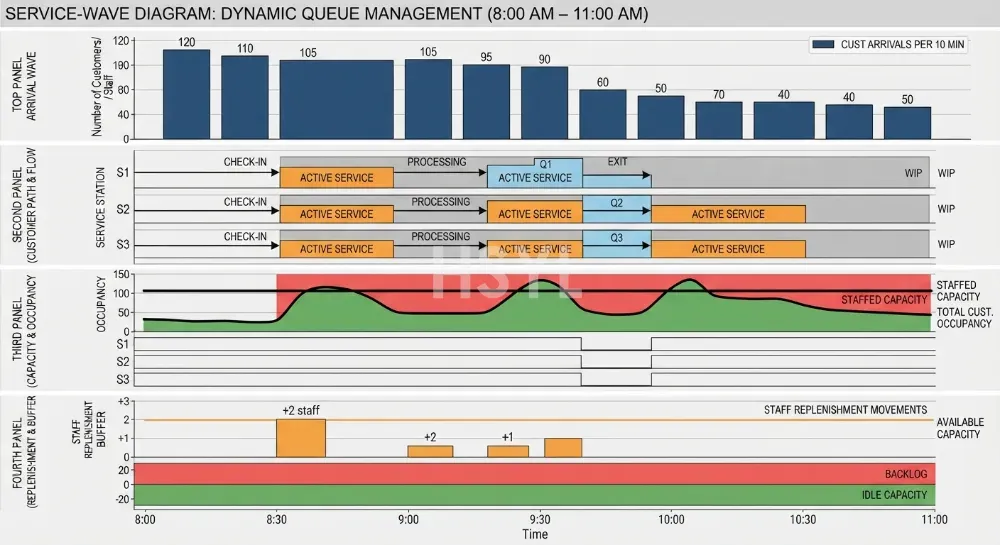
Start with arrivals in short intervals rather than a daily meal total or a single average meals-per-hour figure. Use access-control records, transaction times or manual observations from comparable operating days where available. Separate ordinary days from known peaks such as shift changes, school periods, events or religious and seasonal menu changes.
The demand sheet should show how many customers enter each interval, how long the peak lasts, how much the arrival rate varies and whether distinct user groups arrive together. Record uncertainty instead of smoothing it away. A line serving 600 meals over two hours faces a different duty when 300 people arrive in twenty minutes than when arrivals are evenly distributed.
Follow the Customer Through Required and Optional Decisions
Map the route from tray pickup to exit. Mark which stations every customer must use and which are optional branches. A required rice station, main-dish station and payment point act in series. A beverage island used by only part of the population may be moved off the main route. This distinction prevents an attractive layout from becoming a compulsory sequence of unnecessary stops.
For each station, observe complete customer cycles during representative service. Time the work from the moment a station is ready for one customer until it is ready for the next. Include portioning, customer choice, clarification, utensil return, container change and small interruptions. Use a distribution of observed times; one fastest demonstration is not a design basis.
Find the Slowest Required Station
A useful first calculation for one station is:
theoretical station capacity per hour = parallel active positions × 3,600 ÷ observed seconds per completed customer
For example, if a hypothetical station has two genuinely independent serving positions and the representative observed cycle is 18 seconds, its theoretical rate is 400 completed customers per hour. This is not a promised line output. Shared utensils, one common food pan, staff fatigue, menu questions, payment delays, replenishment and unequal customer choice can reduce effective performance.
For required stations in series, the line is constrained by the station with the lowest sustainable capacity—not by adding every station's rate. Compare the interval demand with each required station and flag any station whose demonstrated capacity or operating availability falls below the arrival wave.
| Station question | Evidence to collect | Common design response |
|---|---|---|
| Does every customer need this step? | Observed path and menu rules | Move optional items to a branch or island |
| Is the task itself slow? | Cycle-time observations and causes | Simplify choice, portioning or presentation |
| Can work occur in parallel? | Independent staff, food access and landing space | Add a true parallel position, not merely counter length |
| Does the station stop for replenishment? | Empty-pan events and exchange duration | Redesign batch size, reserve position or replenishment route |
| Does the next station block release? | Queue and transaction timestamps | Rebalance the downstream step or create a bypass |
Capacity Disappears When Replenishment Is Treated as Background Work
The counter and the kitchen form one production system. For each menu item, record pan capacity at the stated portion, starting quantity, expected take rate, trigger for replacement, travel route, exchange time and the place where a full pan can land safely. A large display pan can reduce exchange frequency but may conflict with product quality, service flexibility or the operator's holding controls. A smaller pan can improve rotation yet increase handling and traffic.
Plot the replenishment route against customer and dirty-return movement. If a trolley must cross the queue or a staff member must leave a service position to fetch food, the apparent serving capacity is unavailable during that event. Coordinate pan and utensil interfaces with the relevant equipment, but do not assume nominal pan count equals sustainable service output.
The operator's food-safety plan must define time and temperature controls for displayed and reserve food. As one jurisdictional reference, the FDA Food Code 2022 is a model offered for adoption in the United States; it includes model hot- and cold-holding provisions and exceptions. It is not a universal rule. Confirm the adopted local requirement, product classification, monitoring method and corrective action for the destination project.
Do Not Let Payment, Condiments or Tray Return Hide Outside the Calculation
A payment point can govern the complete line even when food service is fast. Test the real transaction mix: account recognition, cash or digital payment, discounts, receipts, rejected transactions and customer questions. If payment is a compulsory serial step, its sustainable throughput must meet the same arrival wave. Moving payment away from the food counter may help, but only if the new queue does not block circulation or seating.
Cutlery, condiments and drinks often create short stops because customers make several choices in a narrow zone. Give popular items accessible positions, keep replenishment from opposing customer flow and consider optional islands where the concept allows them. Accessibility, reach, guarding and local building requirements must be reviewed for the actual users and destination; a generic counter height is not a compliant design.
Tray return and warewashing sit downstream, but they can still close the loop. Record when returned trays peak, how many trays and racks are circulating, where scraping occurs and whether clean ware is available for the next service. Treat the dishwashing system as its own load and recovery calculation through the capacity and sizing resource hub; do not infer warewashing capacity from serving-line output alone.
Test the Proposed Line Under a Staged Pressure Wave
Before opening, stage a service trial using the proposed menu pattern, trained staff, representative portions, trays, utensils, payment actions and replenishment movements. Feed participants or safe transaction tokens into the line according to the planned arrival intervals rather than releasing everyone at a convenient steady rate.
Record queue length and waiting time by interval, completed customers, station cycle times, stockouts, pan exchanges, staff movements, payment exceptions, spills, temperature-control checks and any bypasses. Video or timestamped observation can reveal stop-start behavior that a total transaction count misses, subject to the site's privacy policy.
A successful result should demonstrate the agreed demand case and operating controls, not an abstract “meals per minute” claim. Repeat the trial after material changes to menu, staffing, counter arrangement or payment method. If the trial fails, identify the constrained station and correct that cause before adding unrelated equipment.
A Counter Drawing Is Incomplete Without the Operating Story
The counter becomes an operating design only when it carries the arrival profile, menu-choice map, required and optional stations, observed time basis, staffing by position, replenishment schedule, pan and utensil interfaces, food-safety controls, payment assumptions, tray-return interface and staged-test acceptance method. State which data are measured, assumed or still to be confirmed.
Use the canteen kitchen equipment list to define wider project scope, review relevant serving-line equipment, and coordinate the line with the wider facility through the central kitchen planning resources. Model selection should follow the verified duty and interfaces. HSYL throughput, holding performance and configuration claims should only be published for an identified model under stated test conditions.
Turn the Service Wave into a Supplier Test Brief
Use the planned arrival wave to define a practical trial. Illustrative example, not a machine rating: 600 diners over 30 minutes require an average of 20 meals per minute. If 300 diners arrive during the first 10 minutes, the opening interval requires 30 meals per minute. An arrangement that meets the overall average can still develop a queue during that first interval.
| Record during the trial | Why it changes the equipment decision |
|---|---|
| Arrivals in short intervals | Shows the peak rate rather than only the service average |
| Time for tray pickup and portioning | Identifies the station limiting the flow |
| Replenishment interruptions | Shows whether access and backup food positions support the serving rate |
| Available staff at each station | Prevents an equipment-only capacity assumption |
| Dirty-tray return pattern | Connects service to sorting, warewashing and clean storage |
Compare quotations using the same menu, containers, staffing and replenishment assumptions. Keep observed performance separate from any nameplate rate. The factory canteen equipment page connects this trial to cooking, holding, serving and wash-up selection, while the serving-line layout guide covers the physical arrangement.